
This project was taken on during our study of parabolas. We took a video of the bouncing arc of a tennis ball. After I took the video, I used Windows Movie Maker to take an image of each frame of the bounce. In Photoshop, I put together the frame images in Photoshop to create one complete image showing each part of the ball's bounce. Next, I superimposed a grid over the entire image and plotted out the points. Using knowledge from class about parabolas, I used the vertex and zeroes to calculate the formula of the parabola the ball followed. When we were finished I put the images and the steps together into a PowerPoint presentation. This project was a great opportunity for me to exercise my knowledge of parabolas. Real world applications for this type of work include calculating the trajectories of military weapons such as ballistic missiles and long range shooting and trajectories in sports, such as football, baseball, and golf.
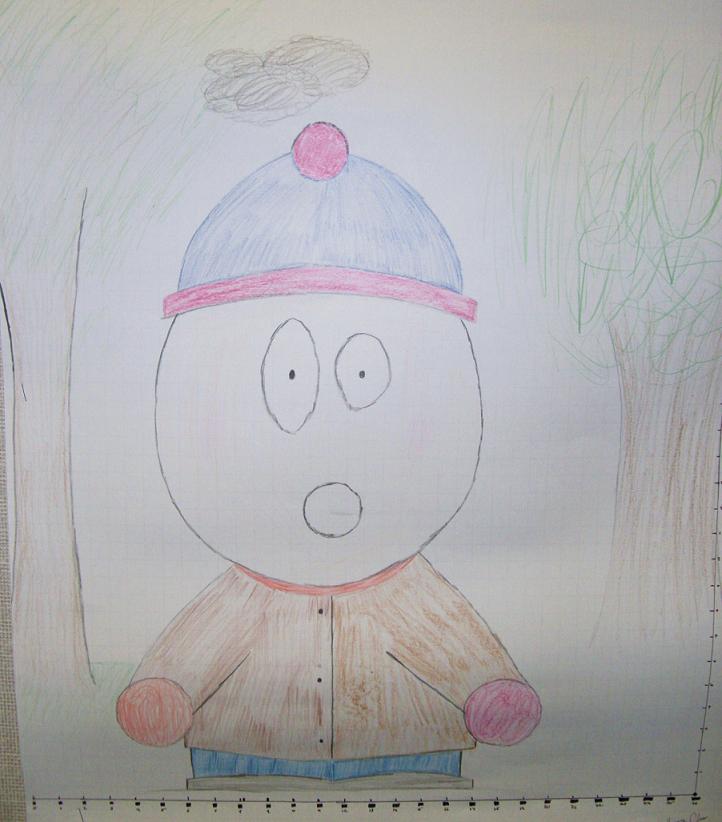 Late in the year, we started our chapter on conic sections. Our class was tasked with creating a poster using a variety of conic sections, including circles, parabolas, hyperbolas, and ellipses. I chose to draw a South Park character because the 2d shapes were simple to replicate using conic sections. When the image was done, I used key points like foci, vertices, co-vertices, and radii to calculate the formulas of the conic sections. The final result was quite impressive and accurate, I think. Because of this project, I was able to refine my skills with conic sections. It was also quite entertaining to be able to use math equations to replicate something from a television show as entertaining as South Park. Life applications for this knowledge could be used to create art for a multitude of purposes.
Since I had done an earlier work on global warming this year, I thought that trends in CO2 measurements would be an interesting thing to do for a statistics project. I selected a set of CO2 measurements made from Mauna Loa Observatory over the last 15 years and assembled them into a variety of presentation forms, including a normal table, a scatter plot, and a box and whisker plot. Data was also analyzed for standard deviation, variance, and central tendency. We used what we knew about finding the mean and variance to find the standard deviation, which in turn was used to find all, if any, outliers. We were also required to write a few things about the relevance and importance of each of the different types of numbers. In the end, this project was an interesting journey into the world of statistics and data analysis. In the real world, this work could be used to analyze data for rising or falling trends in subjects such as stocks, populations, and other census data.
Check out the final product!


